Context
I moved to Toronto and wanted a single place to actually read the Blue Jays season, not a wall of numbers but the charts a curious fan would recognise from a broadcast: where a hitter puts the ball in play, where a pitcher lives in the zone, how a player's value breaks down. Most public tools either assume you already speak sabermetrics or hide the good data behind a membership.
So I built one end-to-end: a Python pipeline that pulls Statcast and MLB
data every night, a Postgres database that stores it, and a Next.js front
end that renders it as hand-built D3 charts. English-first, with an
optional Traditional Chinese toggle for the family back home, where the
navigation and prose translate but player names and baseball jargon
(OPS, wRC+, Statcast) deliberately stay in English, because that is
how the game is actually discussed here.
What I built
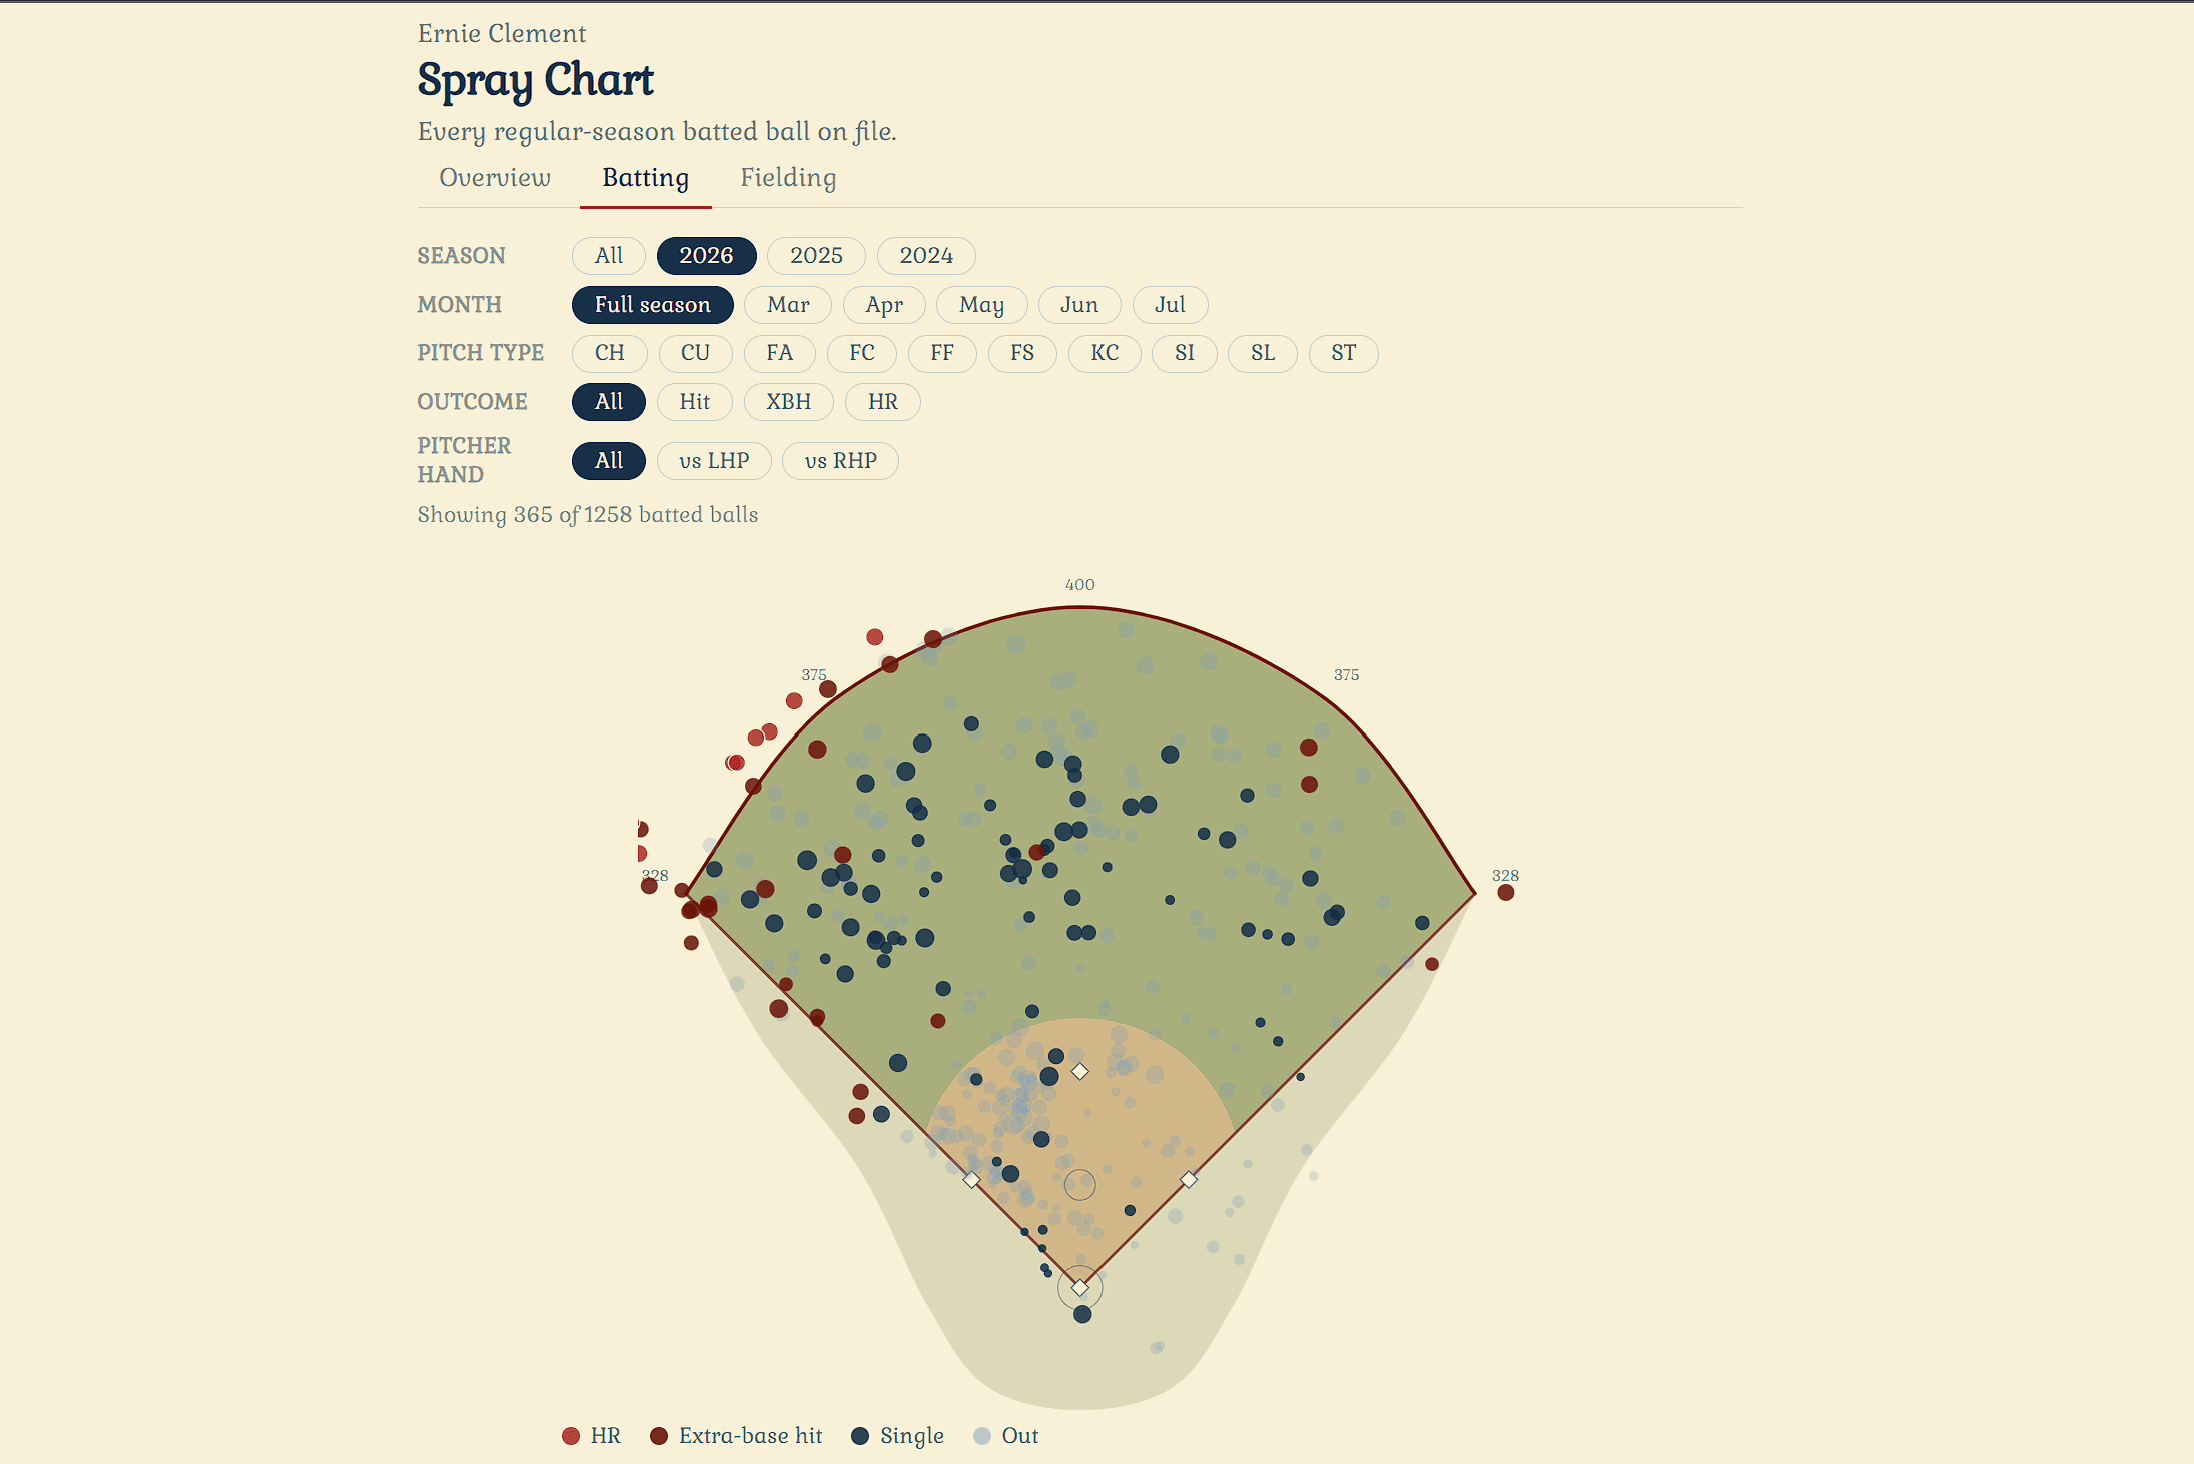
The signature view is a spray chart drawn on real Rogers Centre geometry: each batted ball is placed from its Statcast hit coordinates, coloured by outcome and sized by exit velocity, filterable by season, month and pitch type.
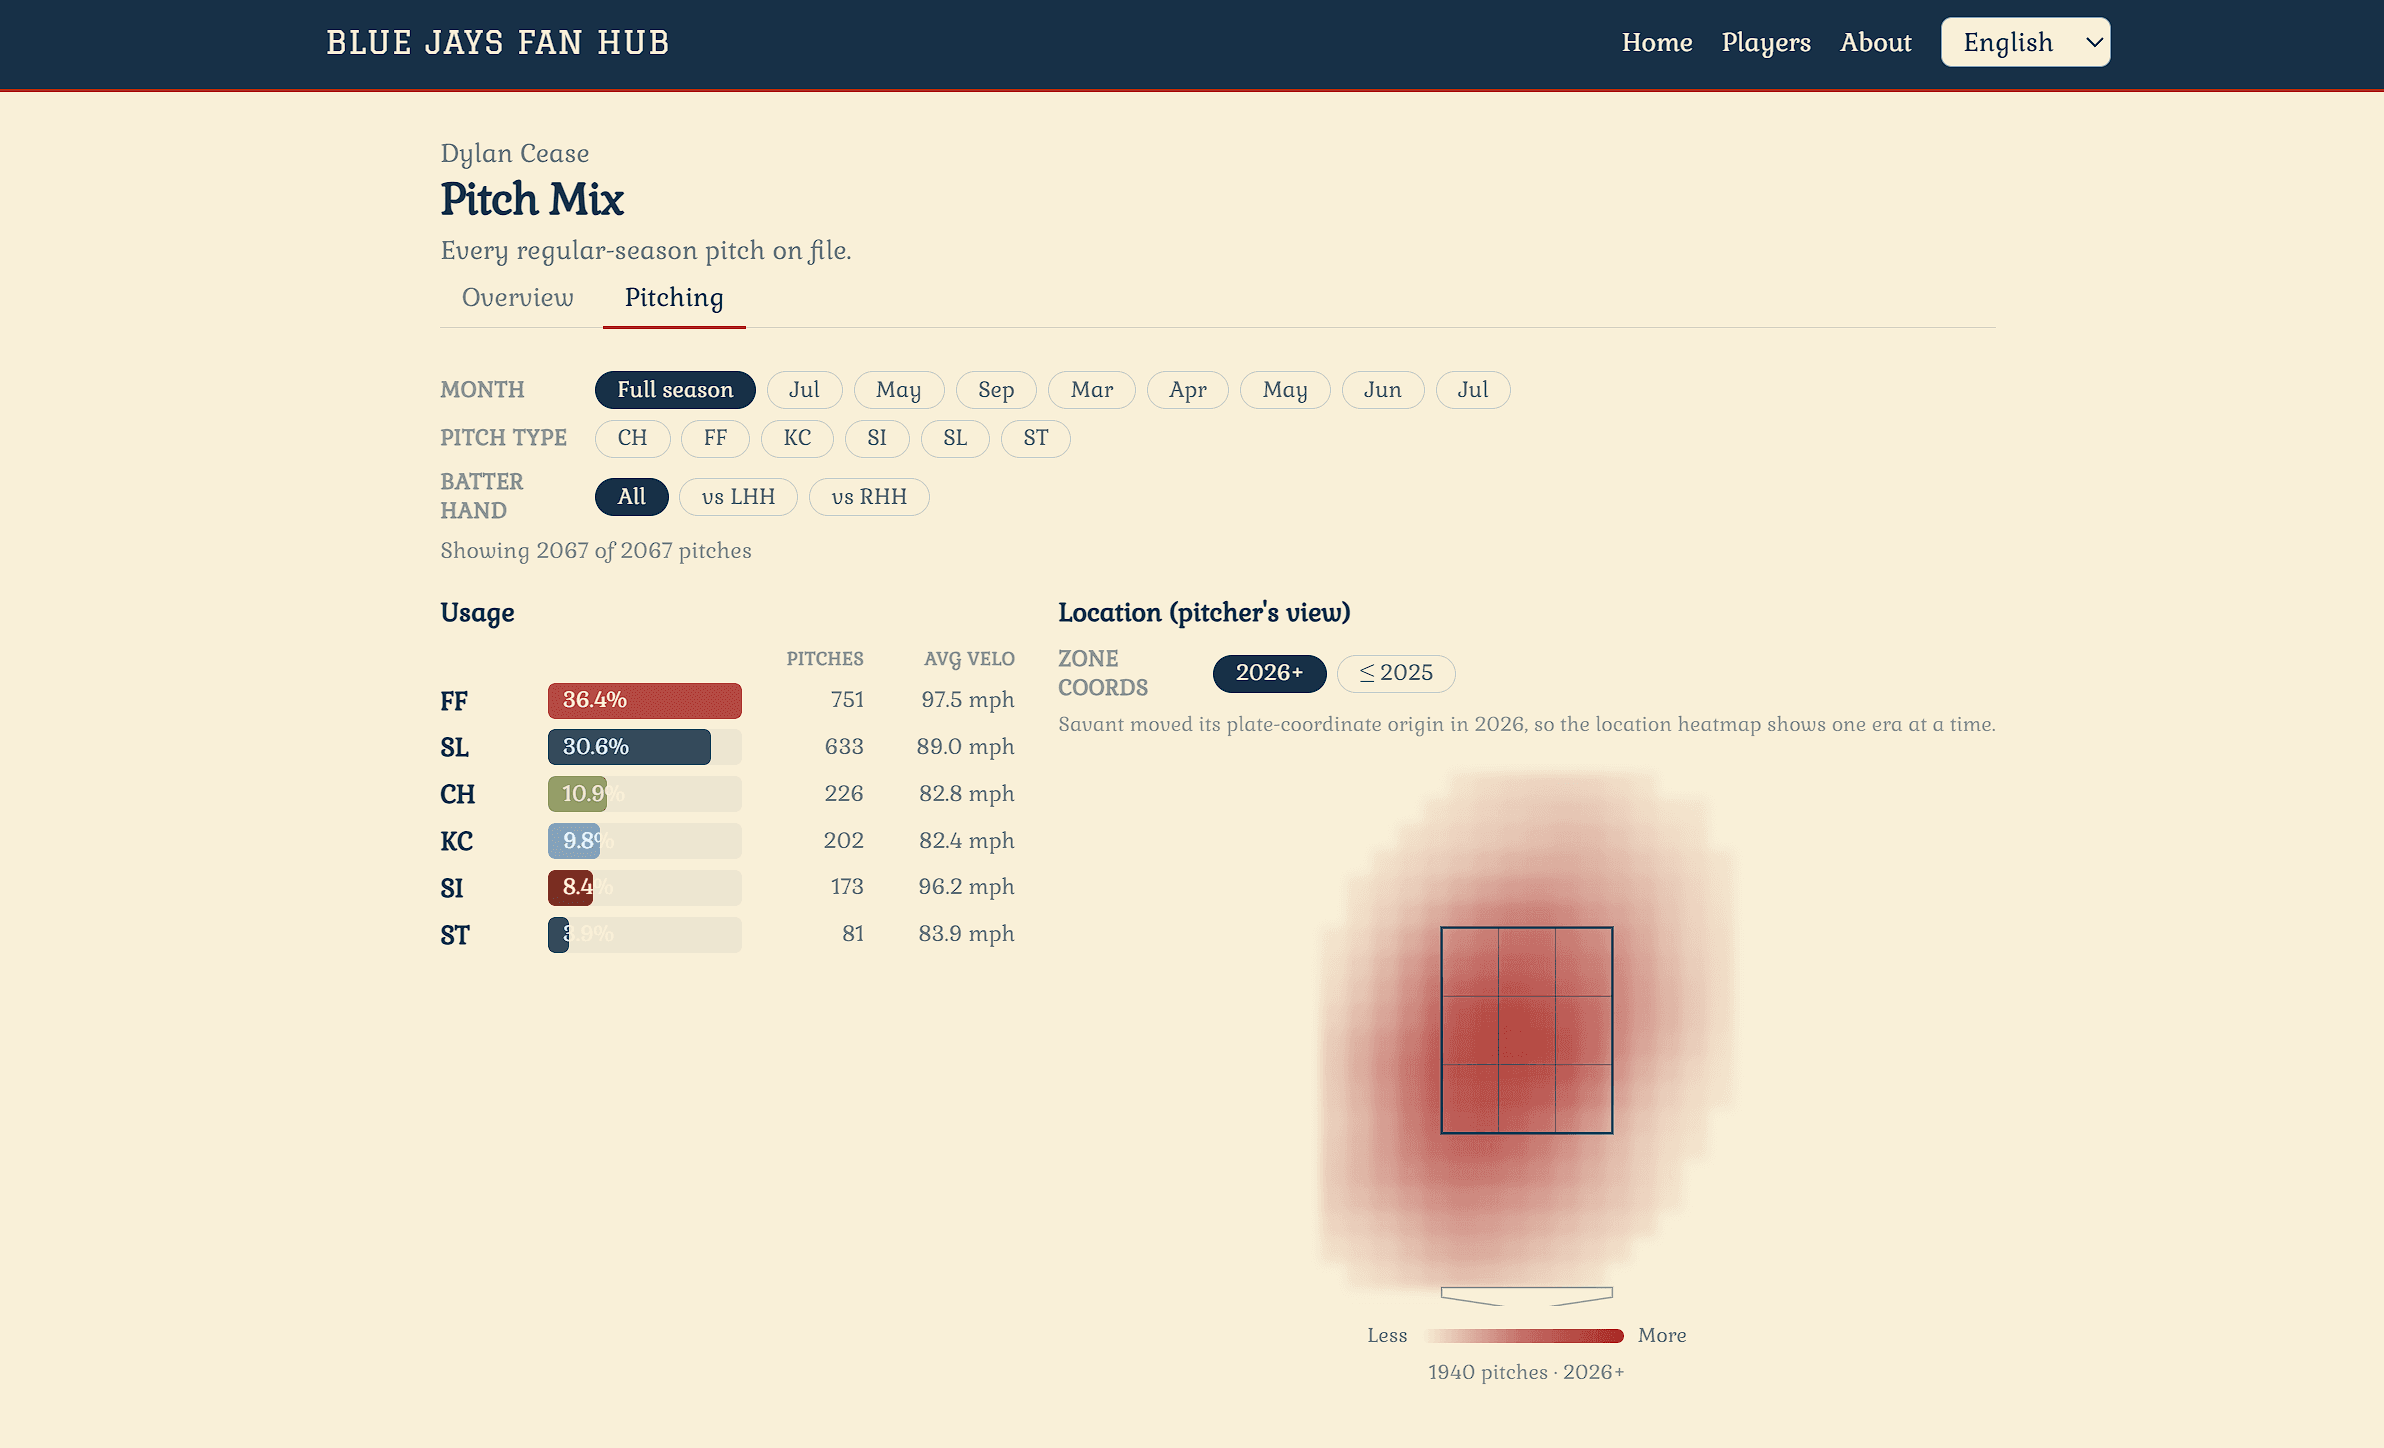
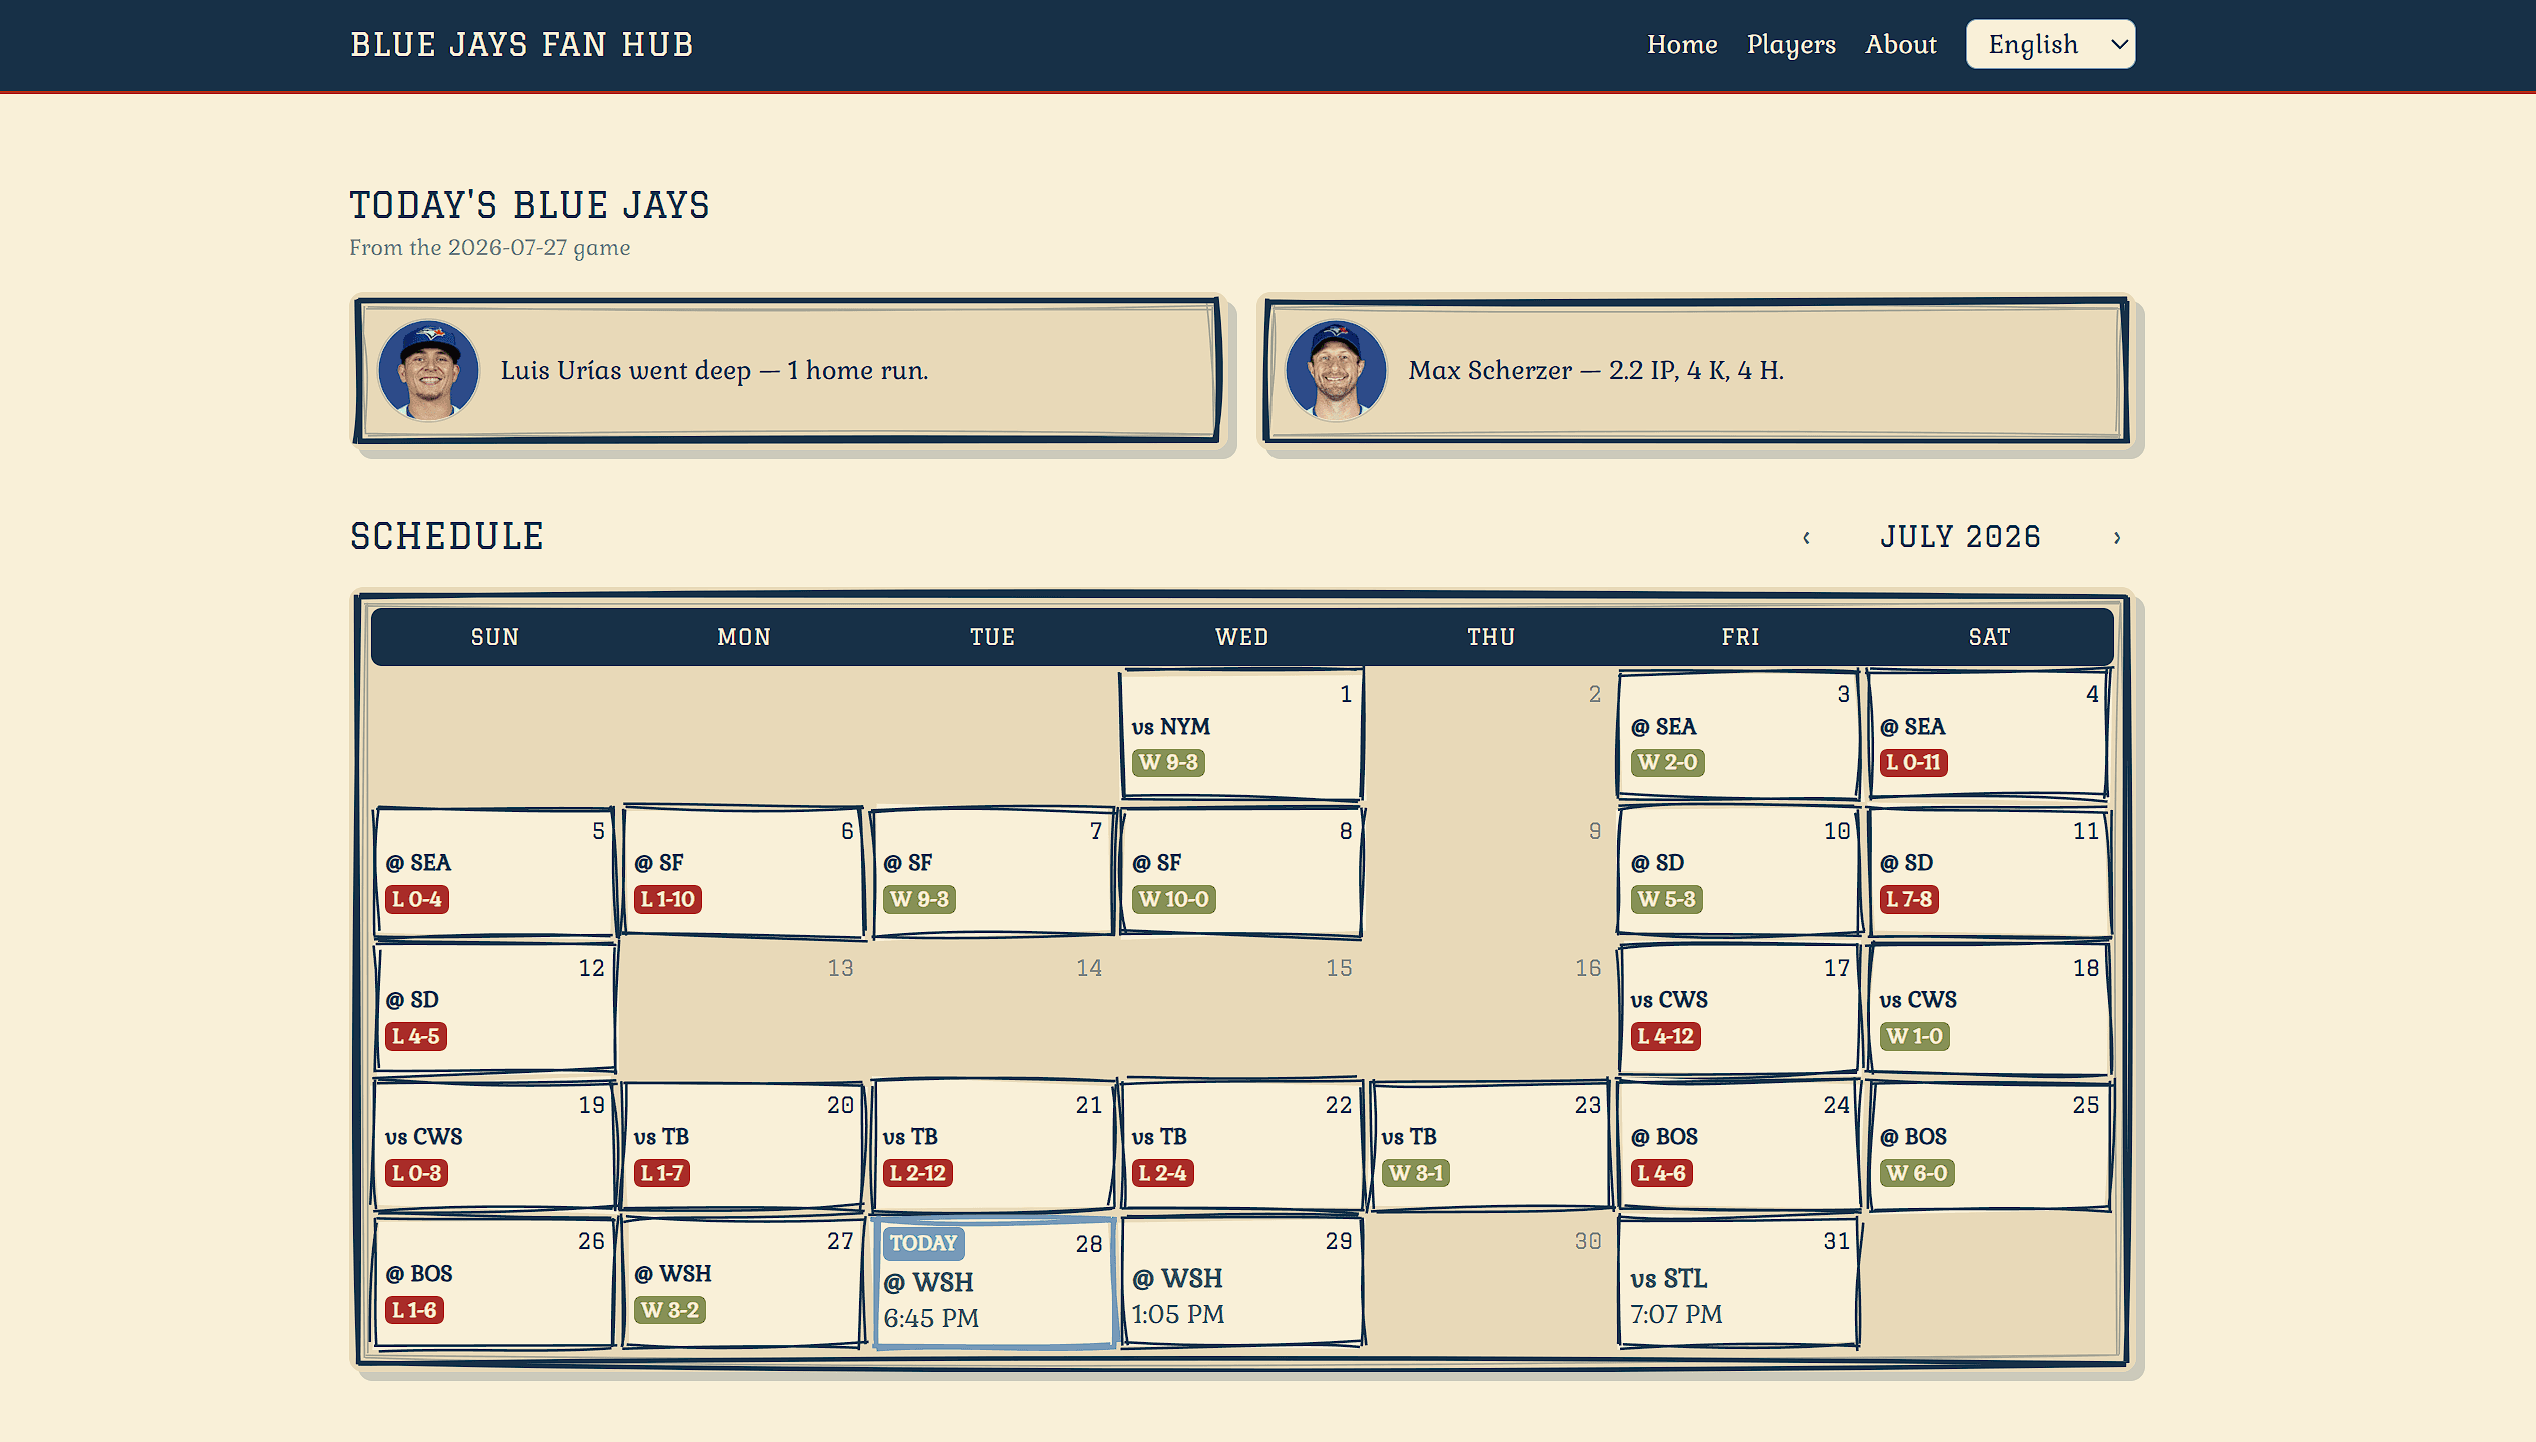
Alongside it: a pitch-zone heatmap built from a 16×20 grid smoothed with a Gaussian kernel and an SVG blur, a multi-position fielding diagram, a batter deep-dive (year-by-year table, recent-form slash lines, a last-ten game log, a 15-game rolling-OPS sparkline), a WAR value-component breakdown, and a hand-drawn schedule calendar with per-game box scores. The player overview pages are written for a casual fan first: KPI cards pair each metric with a plain-language hint, so someone who doesn't already speak sabermetrics can still read the page.
The data flows through four stages, refreshed on a schedule:
Baseball Savant + MLB Stats API
pybaseball · Python ETL
transform + idempotent upsert
hc_x/y → feet · plate alignment
Supabase Postgres
web_* tables
Next.js render
D3 · rough.js · SVG
GitHub Actions cron refreshes overnight → /api/revalidate drops the ISR cache
Key decisions & tradeoffs
The ETL lives outside the app. pybaseball is too heavy for a
serverless request, so I never pull data at request time. A GitHub Actions
cron runs the Python pipeline, writes to Supabase, then calls a
/api/revalidate endpoint so Next.js ISR caches drop in seconds. The
alternative (pulling inside a Vercel function) would have meant slow cold
requests and timeouts. The cost is that the site is fresh overnight, not
live; for a fan reading yesterday's game that is the right trade.
Season stats stay honest about their source. FanGraphs is the only source for WAR components, wRC+ and the like: there is no API, and the scrapers now return HTTP 403. Rather than scrape against their terms, I export the numbers as CSVs behind my own membership, drop them into a gitignored folder, and load them with a warning-not-crash if a file is missing. Roster enumeration ("who played for the Jays that year") moved to the MLB Stats API's full-season endpoint instead. The self-built Savant charts (spray, heatmap, fielding) are the part the public site actually ships; the licensed numbers stay as private inputs.
Plate-alignment tagging, because the data quietly changed. In 2026
Statcast moved plate_x/plate_z from front-of-plate to middle-of-plate.
Overlaying two seasons of pitches would silently misalign the zone by one
to three inches. I tag every event front or middle at ingest and scope
the heatmap to a single alignment, so the chart is either correct or
empty, never subtly wrong. Fail-loud beats a plausible-looking heatmap.
Treat late-arriving corrections as a first-class case. Statcast
retroactively re-classifies pitches after games, so a one-time backfill
would slowly drift out of date. The nightly job re-pulls a rolling
seven-day window for the current season and upserts on a composite key,
while completed historical seasons stay frozen. Small correctness details
got the same attention: innings pitched are rebuilt from stored outs
rather than trusting Statcast's 5.2 decimal, which is really "5 and ⅔"
and breaks naive arithmetic.
Pre-aggregate in the pipeline, keep the read path thin. Season lines
are computed once in the ETL and stored per player-season; pages never
grind thousands of Statcast rows on a request. The D3 components take plain
JSON, not a database client, so they stay framework-pure and testable.
Because the Supabase project is shared with other work, every table is
namespaced with a web_ prefix, a small discipline that avoids
collisions with a pre-existing players table.
Results
Three seasons (2024 through 2026, including the 2025 playoffs) are backfilled for every 40-man Blue Jay, and the nightly cron keeps the current season current. Spray charts, the pitch heatmap, the fielding diagram and the batter deep-dive all ship in English and Traditional Chinese. The WAR breakdown reconciles its six run-value components back to RAR on the page.
The build also grew a full pitcher side: an arsenal table with per-pitch usage, velocity, spin, whiff rate and expected-wOBA-on-contact, a horizontal-and-vertical movement chart, and a rolling velocity trend. Fielding uses Statcast's fielding run value rather than a metric that would have required paid data: a recurring theme in the project, where the choice of source was as much a design decision as the chart on top of it.
The project is really two disciplines meeting: a fail-loud data pipeline that refuses to approximate, and a front end where every chart is drawn by hand rather than dropped in from a library.
Stack & links
Next.js 16 (App Router) · TypeScript · Tailwind · D3 · rough.js
· Supabase Postgres · Python + pybaseball · GitHub Actions ·
Vercel